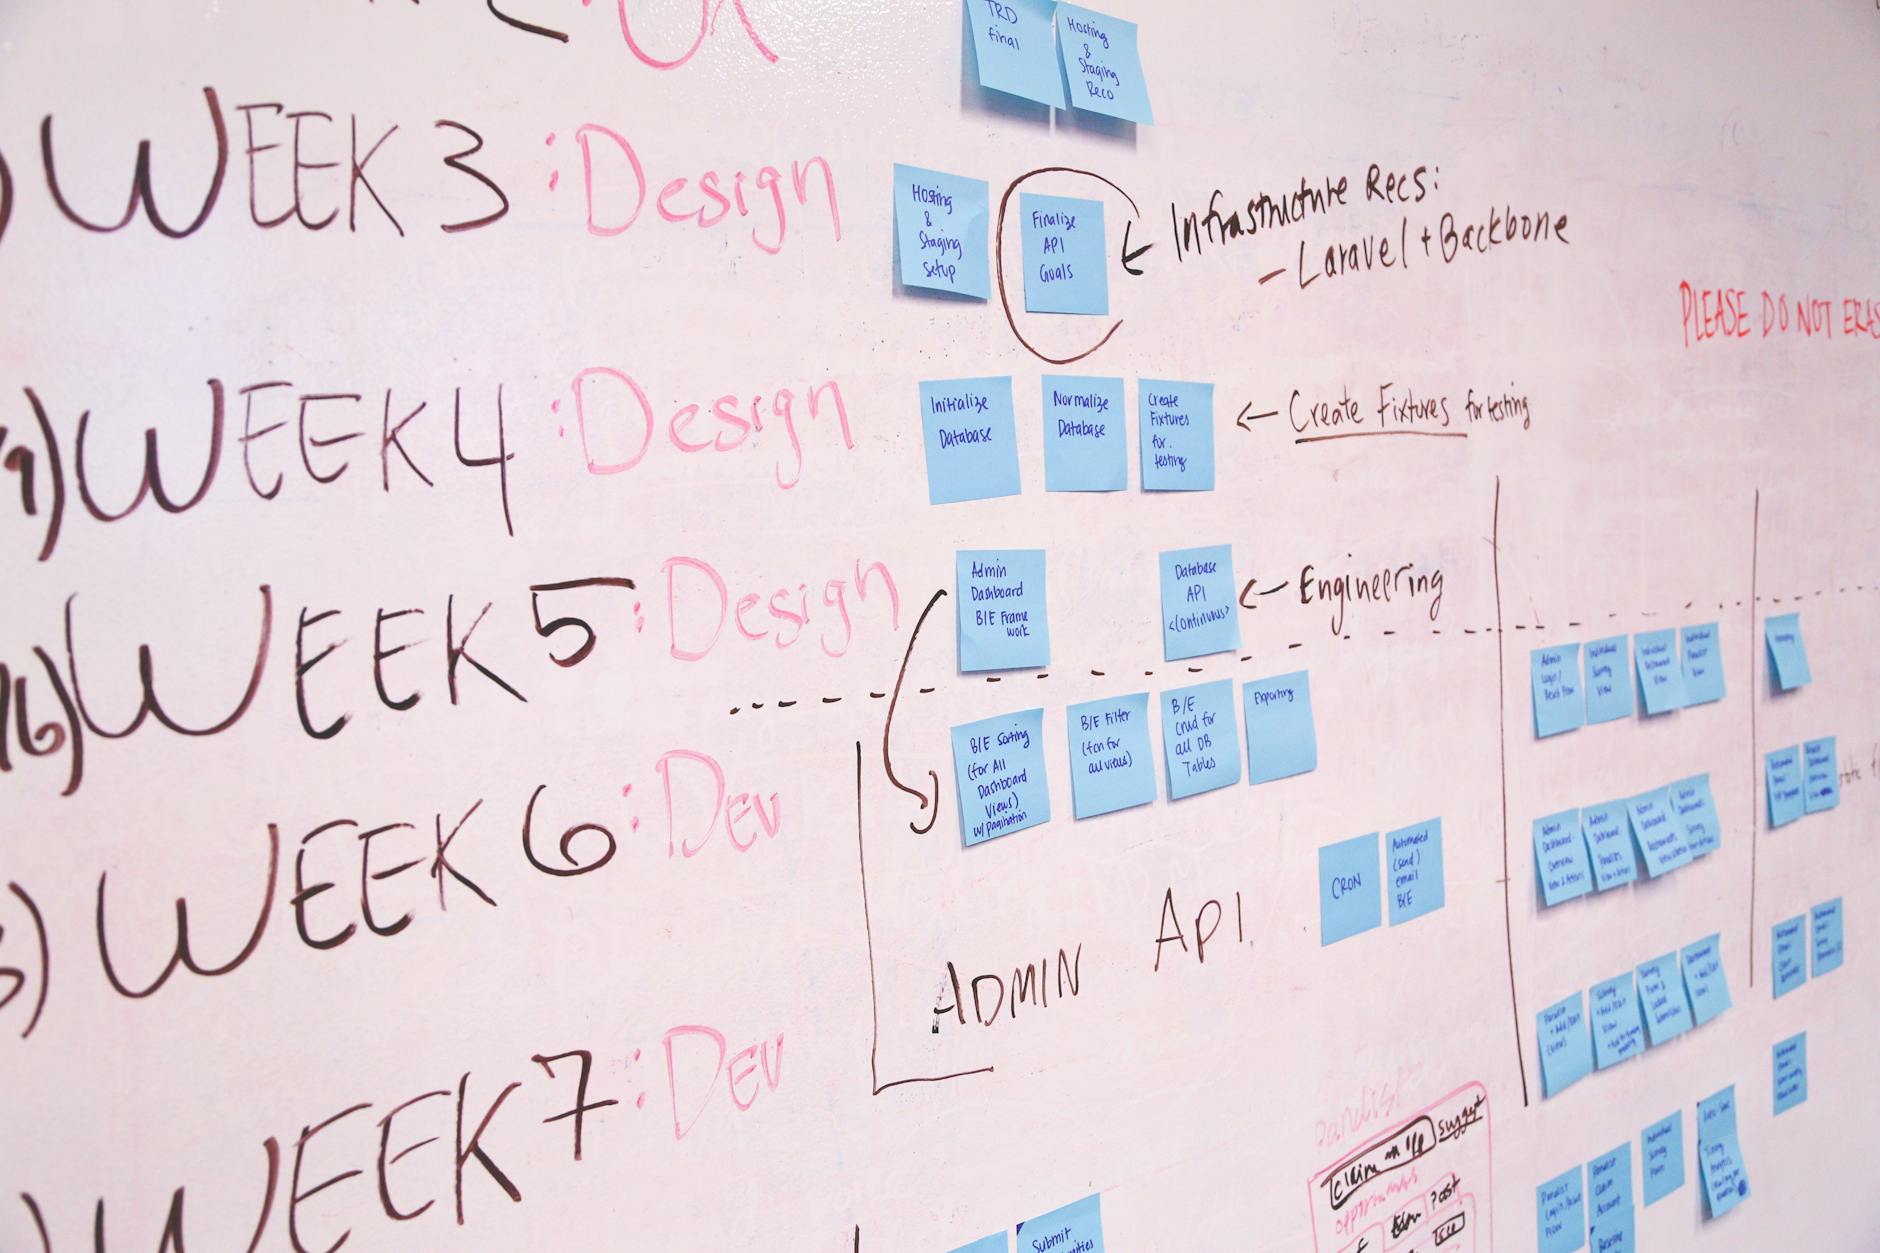
As recommended, I decided to create a project management chart regarding the white paper due at the end of the class. For the software itself, I went with Trello, because I realized when I was watching the video on recommendations for project management programs that I had actually interacted and used it for managing work in an old internship I was in, which was a nice surprise.
I’ve had a simmering interest in UX/UI (User Experience/User Interface) for a few years now, so when I was watching the video on Project Management Approaches, I was excited to learn about Design Thinking given it is frequently utilized in the space. I also appreciate that instead of research to describe the process of understanding the user or audience, they use the term empathize instead to describe that preliminary process, which I feel humanizes the people we are making products and content for more, which should be second nature but isn’t. I also appreciate that it was acknowledged that the process of using this method was non-linear. since I feel many planning approaches of all kinds end up being so anyway.
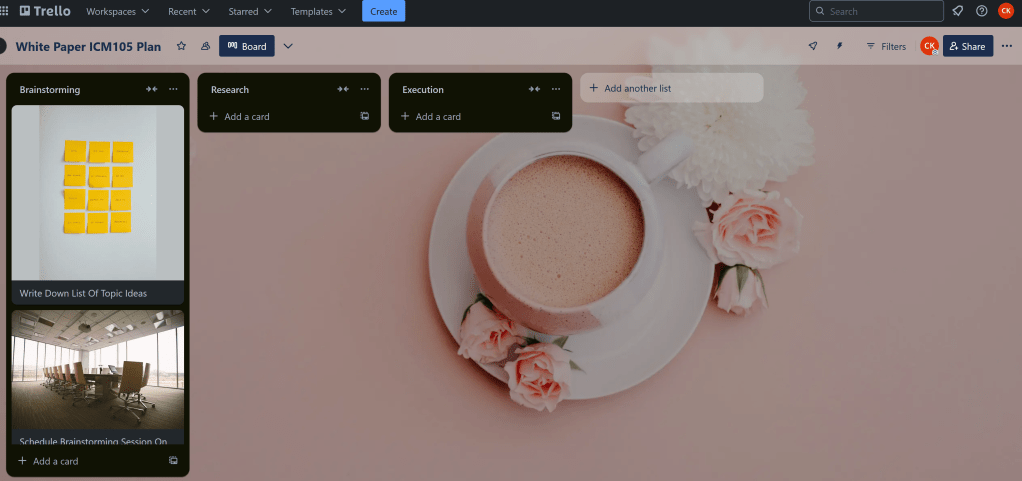
While I really appreciate the Kan Ban approach mentioned in another video we were asked to watch, I felt it was to simplistic of an organizational structure, so I decided to have my first three lists be titled as Brainstorming, Research, and Execution.
I really enjoyed that Trello had such a large image library that you could access for free for assigning images to cards and giving the whole board a nice background. I am a sucker for customization and decorating in any aspect of my life, be it my obsession with stationary, my love of putting stickers on everything, and most of the games I play allowing some aspect of character customization, even if it’s as simple as just picking pronouns. So choosing a nice background for my board I feel not only made me enjoy the process of making it more, but also may encourage me to use it more in the future for future projects.
Everything is so sleek and colorful looking, which draws me in immediately and makes me want to pay attention to it, which is nice. Far beats an Excel or Google Charts spreadsheet.


Leave a comment